Dynamic geospatial modeling of mycotoxin contamination of corn in Illinois: unveiling critical factors and predictive insights with machine learning
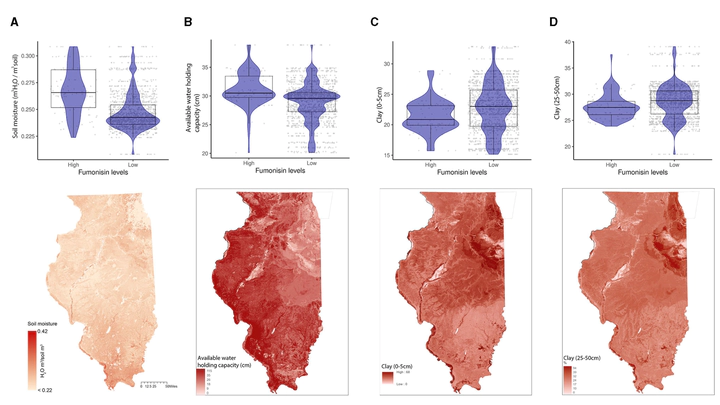 Soil properties relationship with fumonisins contamination levels (FUM) and their geospatial distribution in Illinois (USA). (A) soil moisture (m3 H2O/m3 soil), (B) available water-holding capacity (cm), (C) percentage of clay content from 0 to 5 cm below surface, (D) percentage of clay content from 25 to 50 cm below surface; For FUM, high is >5 ppm, and low ≤5 ppm. The violin plot depicts the density distribution of the soil properties in low and elevated levels of mycotoxin contamination. Maps of geographical shaded red in relation to soil properties values.
Abstract
Mycotoxin contamination of corn is a pervasive problem that negatively impacts human and animal health and causes economic losses to the agricultural industry worldwide. Historical aflatoxin (AFL) and fumonisin (FUM) mycotoxin contamination data of corn, daily weather data, satellite data, dynamic geospatial soil properties, and land usage parameters were modeled to identify factors significantly contributing to the outbreaks of mycotoxin contamination of corn grown in Illinois (IL), AFL >20 ppb, and FUM >5 ppm. Two methods were used: a gradient boosting machine (GBM) and a neural network (NN). Both the GBM and NN models were dynamic at a state-county geospatial level because they used GPS coordinates of the counties linked to soil properties. GBM identified temperature and precipitation prior to sowing as significant influential factors contributing to high AFL and FUM contamination. AFL-GBM showed that a higher aflatoxin risk index (ARI) in January, March, July, and November led to higher AFL contamination in the southern regions of IL. Higher values of corn-specific normalized difference vegetation index (NDVI) in July led to lower AFL contamination in Central and Southern IL, while higher wheat-specific NDVI values in February led to higher AFL. FUM-GBM showed that temperature in July and October, precipitation in February, and NDVI values in March are positively correlated with high contamination throughout IL. Furthermore, the dynamic geospatial models showed that soil characteristics were correlated with AFL and FUM contamination. Greater calcium carbonate content in soil was negatively correlated with AFL contamination, which was noticeable in Southern IL. Greater soil moisture and available water-holding capacity throughout Southern IL were positively correlated with high FUM contamination. The higher clay percentage in the northeastern areas of IL negatively correlated with FUM contamination. NN models showed high class-specific performance for 1-year predictive validation for AFL (73%) and FUM (85%), highlighting their accuracy for annual mycotoxin prediction. Our models revealed that soil, NDVI, year-specific weekly average precipitation, and temperature were the most important factors that correlated with mycotoxin contamination. These findings serve as reliable guidelines for future modeling efforts to identify novel data inputs for the prediction of AFL and FUM outbreaks and potential farm-level management practices.